
Return to MODULE PAGE
Analysis of the Müeller-Lyer Experiment
Gordon Redding: Author
The first question to address is whether this experiment provides support for the linear perspective hypothesis and explains why we suffer from Müller-Lyer Illusions. Has the experiment accomplished that goal? That is a rather complicated question.
First we must consider the experimental methods that were employed. Experiments are defined by the creation of different situations of observation, situations that are changed very carefully and systematically. In contrast, non-experiments involve observation of behavior in naturally occurring situations, situations that differ in unknown ways. Both kinds of methods can be scientific because they depend upon empirical observation to identify relationships between situational and behavioral variables. However, experimental methods permit stronger conclusions because they enable more complete knowledge (control) of differences between observed situations. In experiments we know more exactly what attributes of the situations are responsible for any change in behavior. We will now examine the design features of the present experiment in terms of the variables they control.
Our vision experiment used four experimental stimuli. There were two arrow junction stimuli, one of which depicted a non rotated convex virtual corner and the other a virtual convex corner rotated 20 degrees.
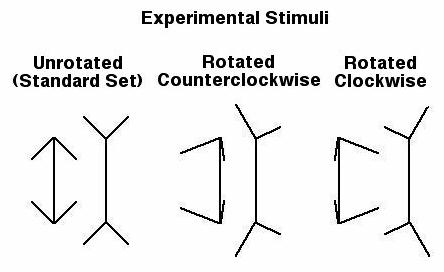
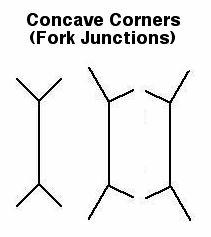
There were also two fork junction stimuli, one of which depicted a non rotated concave virtual corner and the other a virtual concave corner rotated 20 degrees. Therefore, the four experimental stimuli were different in terms of kind of virtual corner (convex or concave) and amount of rotation (0 or 20 degrees). Kind of virtual corner and amount of rotation were the manipulated variables. Manipulated variables are call "independent variables".
The four experimental stimuli represent the four created situations, four conditions in which we observed behavior. The creation of experimental conditions by combining the levels of the independent variables in all possible ways is called a "factorial design". With such a design we can examine how each of the independent variables affect behavior and how the independent variables combine to affect behavior.
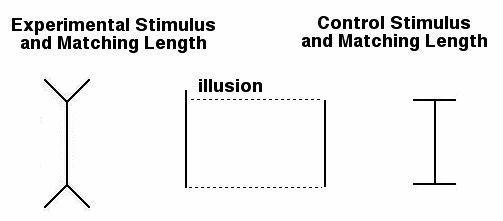
The behavior studied was participants' report of perceived size. This was measured by having participants adjust a response line to match the perceived size of the target line. Matching size was the measured behavioral variable. A measured variable is called a dependent variable. So, during the experiment, when you changed the length of the line on the right, trying to match the length of the simuli on the left, you produced behavior that we can measure and analyze (i.e. a dependent variable).
We used the "matching size" dependent variable to obtain a measure of the illusion, the misperception of line length. For this purpose, we included a control stimulus. The control stimulus was the line with right angle or "T" junctions, forming a sideways "H" shaped stimulus.
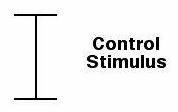
Differences in matching length between each of the experimental stimuli and the control stimulus provided a measure of the illusion. That is, the experiment recorded your response to both the experimental stimuli (the arrow and fork junctions) and to the control stimuli (the sideways "H" shape). The greater the difference in length between the line you matched to the experimental simuli and the line you matched to the control stimuli -- the greater the illusion was for you.
This illusion score enabled us to test predictions from the hypothesis. But there is more to the experimental design. Why?
First, why include a control stimulus? What did it control for? You might think that we could have just compared the matching size of each experimental stimulus with the physical length of the line. This procedure would assume that participants would have been perfectly accurate in matching the size of the experimental stimuli, except for the distortion produced by the arrow and fork junctions. But participants are not usually perfectly accurate in their perceptual reports. Arrow and fork junctions are not the only reasons people make errors in their perceptual reports. For example, people generally tend to underestimate size, especially for larger objects. And, from trial to trial, participants are more or less attentive, more or less careful in their matching response. The control stimulus controls for such inaccuracies in perceptual report. Because these sources of inaccuracy are arguably present for both experimental and control stimuli, when we take the difference between these stimuli we subtract out such inaccuracies and don't confuse them with the illusion.
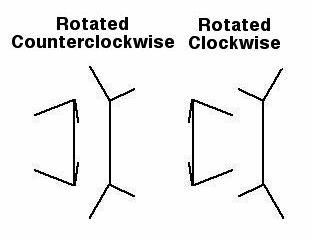
Another feature of the experimental design was manipulation of the direction of virtual corner rotation. Different groups of participants received stimuli produced by clockwise or counterclockwise rotation about the virtual axis of the virtual corners (see figure above). Because different groups of participants experienced different levels of this variable it is called a "between-subjects" variable. Participants are called "subjects" because they are the subject of our investigation, their behavior is what we are subjecting to study. In contrast, participants experienced both levels of each of our other manipulated variables (kind of virtual corner and amount of virtual corner rotation) and these variables are called "within-subjects" variables. Put simply, when the designer of this experiment put together the sets of images that would be shown to various subjects, he controlled how frequently particular subjects were shown images with particular properties.
(1) The experiment controls the KINDS of corners that subjects see.: Each subject sees equal quantities of both convex virtual corners (arrow-shaped)
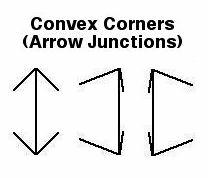
and concave virtual corners (fork-shaped).
So the shape of the virtual corners (concave vs. convex) is an independent variable (i.e., manipulated by the experimenter) and it is within-subjects (i.e., everyone tested gets the same percentage of both concave and convex corners).
(2)The experiment controls the Degree of Rotation of the Corners: Each subject sees equal quantities of unrotated corners (i.e., where the perspective is straight onto the corner and not at an angle).
So the degree of rotation of the virtual corners (0 degrees or 20 degrees) is also an independent variable and it is also within-subjects.
(3) The experiment controls the Direction of Rotation of the Corners: Each subject did not see corners rotated in the same direction.
Of the rotated corners that subjects saw, some subjects saw more / all rotations in a clockwise direction, while others saw more / all rotations in a counter-clockwise direction. So the direction of rotation is a control variable and it is between-subjects.
CHALLENGE: Most independent variables can be tested either between-subjects or within-subjects. For example, we might have different groups of participants receive each of our experimental and control stimuli. Can you say why we chose to test our independent variables within-subjects in this experiment?
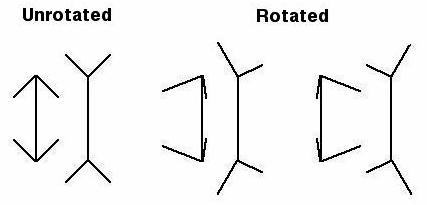
Because the hypothesis makes no prediction for direction of virtual corner rotation, this variable is called a "control" variable, rather than an independent variable. But what is it controlling for? We don't necessarily know! A good experimental design controls for as many variables as possible. In this case, there is one quite noticeable feature of the corners that have been rotated by 20 degrees. The left and right side of the figures are no longer mirror images of one another as they are in the unrotated corners (see figure XX above). Such figures are described as bilaterally asymmetrical. Since this is a difference that could conceivably affect subject's responses it seemed a good idea to control for this difference. People may attend differently to left and right sides of our stimuli and consequently make different matching responses. In this experiment, we do not want such differences to influence the outcome. When we combine our data over direction of virtual corner rotation we average out the contribution of such bias in responding.
Another manipulated control variable was the repeated trials. We presented first a block of practice stimuli followed by four repeated blocks of the experimental and control stimuli. Why? The practice trials familiarized the participant with the task so that when the experimental trials occurred we could be reasonably sure participants were doing what we asked them to do. In particular, the practice stimuli were all plain lines, without junctions, so that participants would become used to matching lines and not include the junctions on the experimental stimuli in their matching response. The repeated blocks of the experimental stimuli were intended to produce more reliable data. No one is ever perfectly accurate all of the time. By averaging our data over repeated trials we can be more confident that we have accurately measured our participants' behavior.
But there were plain line stimuli without attached junctions mixed in with the experimental and control stimuli. Why? These were actually control stimuli, but because their purpose was different from the control stimulus we call them "filler stimuli". There were two long filler stimuli and two short filler stimuli. They were included to keep participants making a range of matching responses. This is especially important because all of the experimental and control stimuli were actually the same length! Even with the illusion, participants might have begun to make a narrow range of response and attenuate the illusion. The filler stimuli also kept the participants in the habit of matching only the length of lines, not including the junctions in their judgments.
Another control variable in our design was the order of stimuli within each block of trials. However, we didn't control this variable by manipulation; rather, we randomized the order. Each time the stimuli in a block were presented they occurred in an unpredictable order. What were we controlling for? Behavior is influenced by previous behavior. For example, after making a long matching response a participant may feel like making a short response, regardless of what the stimulus is. In such case, response to an arrow junction stimulus would possibly be different depending upon whether it was preceded by another arrow junction stimulus or a fork junction stimulus. Previous experience "carries over" to later experience and influences behavior. Hence, such influences are called "carryover effects". When we randomized the order of stimuli within blocks we know that, in the long run at least, each stimulus will precede and follow every other stimulus an equal number of times. Thus, any carryover effects are averaged out when we combine our data over participants.
CHALLENGE: Another way to control for carryover is called "complete counterbalancing". We could have had each participant receive all possible orders of the nine stimuli in different blocks of trials. The number of possible orders is the factorial of the number of different stimuli (i.e., 9!). If we had done that we would have known for certain (not just probably!) that each stimulus preceded and followed every other stimulus an equal number of times for each participant. Do you know why we did not use complete counterbalance? Are there others ways of controlling for carryover, other than randomization or complete counterbalancing?
Yet another randomized control variable in our design was the starting length of the response line, small or large. From trial to trial the starting length of the response line changed in an unpredictable manner. But what were we controlling for? Different people tend to overshoot or stop short of their perceived size in adjusting the response line. Overshooting and undershooting the "true" value may also vary across trials for the same person. By randomizing starting length of the response line, we know that in the long run each stimulus will be responded to equally often from a short and long starting length for the response line. When we combine our data for each stimulus over repeated trials and over participants we average out such starting length biases.
Let us summarize, then, all of the factors that were manipulated and controlled in this experiment:
- Manipulated kind of virtual corner (independent variable)
- Manipulated rotation of virtual corners (independent variable)
- Measured matching size (dependent variable)
- Controlled for other factors influencing response (control stimulus)
- Controlled for asymmetry of rotated corner stimuli (direction of rotation)
- Controlled for practice at the task (practice stimuli)
- Controlled for reliability of the matching response (repeated blocks of trials)
- Controlled for carryover of one response to a following response (random stimulus orders and random starting length of response line)