Return to MODULE PAGE
Results of the Müeller-Lyer Experiment
Gordon Redding: Author
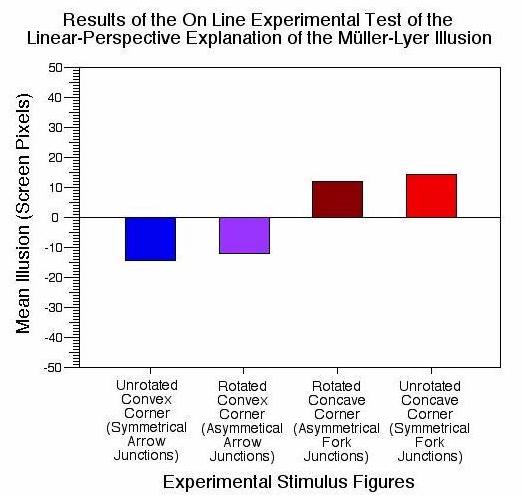
The question that we all want an answer to is: What does the experiment show? Does it provide support for the linear perspective hypothesis? The answer is "Yes" but with a qualification. First, let's see why the researcher who designed the experiment would argue that the data does support the hypothesis. Here is a graph that shows the results of trials done with one group of subjects.

The illusion was calculated by finding the difference between matching size for experimental stimuli (arrow and fork junctions) and control stimuli (T junctions). According to the linear perspective hypothesis, the lines with arrow junctions should produce a negative illusion score (less than the control), while the lines with fork junctions should produce a positive score (greater than the control). And the prediction was that lines with asymmetrical junctions (rotated corners) should produce less illusion than lines with symmetrical junctions (unrotated corners). That is, lines with asymmetrical arrow junctions should have a less negative illusion score than lines with symmetrical arrow junctions, while lines with asymmetrical fork junctions should have a less positive illusion score than lines with symmetrical fork junctions. Did the prediction turn out to be accurate? . . . Well it certainly seems to be. The straight on corners, with the symmetrical fork and arrow junctions produced the greatest illusions. The rotated corners (asymmetrical) produced some illusion but not as much (just as the hypothesis predicted).
Does the data provide evidence that is consistent with the truth of the linear perspective hypothesis? Yes. It is what the theory predicts (within a reasonable degree of accuracy). Since the evidence is consistent with the theory, does that mean that the linear perspective hypothesis has been proven to be true? No. That is too strong a claim. The author of this experiment (Dr. Gordon Redding) claims that any difference in the illusion for stimuli depicting rotated and non-rotated virtual corners is due to the difference in virtual corners. Do you think he is right? Maybe he is. But we can't draw this conclusion with absolute certainty because there are other possible explanations for the data, as Dr. Redding himself is willing to admit. The experimental stimuli have been divided into two groups: those with rotated virtual corners and those with unrotated virtual corners. The two groups do vary with respect to the "degree of the rotated corner". But, they may also differ with respect to any number of other properties. And if they do, the explanation for the experimental results may turn out to depend primarily on this other property, rather than on the property identified by the linear perspective hypothesis (i.e., the degree of the rotated corner).
If there are two different properties (variables) that change in a parallel way, then the same experimental results will give equal support to two different hypotheses, each claiming that only one of the properties provides the proper explanation for the outcome of the experiment. A variable that co-varies (changes its level) with an independent variable is called a "confounded variable". Can you identify a confounded variable in our design that might explain the results?
For a more detailed discussion of what can (and cannot) be learned from the results of this experiment, see "Muller Lyer Experiment Debriefing"


